Affiliate Radio Engineer & Astronomer
Windward Community College Radio JOVE
Radio spectrograms are generated by special receivers that depict signal strength as a function of both time and frequency. In the following images blue represents a low signal level while red is strong. These displays are useful for Jove observers to see where activity is occurring in real-time. The horizontal (x-axis) is universal time and the vertical (Y-axis) is frequency in MHz. The following gallery of spectrograms will give you some idea of the appearance and diversity of Jovian and solar emissions as well as other signals often seen on the spectrograms.
Jupiter
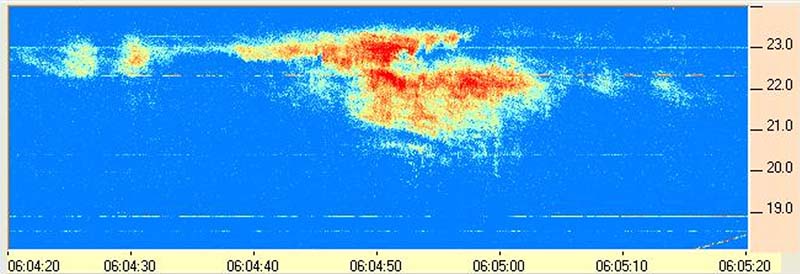
Jupiter L-burst activity
Jupiter L-bursts (long bursts) often sound like ocean waves breaking up on a beach when monitored with a shortwave radio tuned to a fixed frequency. (Does this look like the Starship Enterprise - or is it just my imagination?)
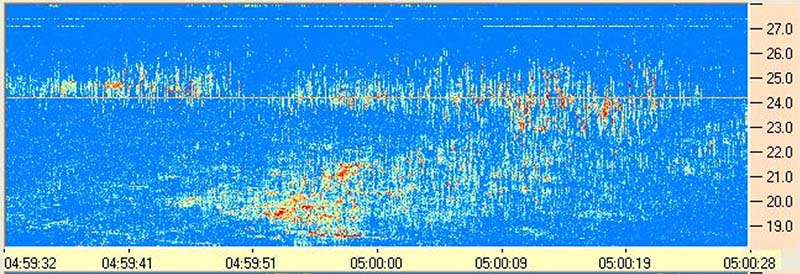
Jupiter S-Bursts and L-Bursts Jupiter S-bursts (short bursts) seen near the top of this record often sound like popcorn popping or a handful of pebbles thrown onto a tin roof when monitored with a shortwave radio tuned to a fixed frequency. Each individual S- burst lasts for only a fraction of a second and bursts can occur at rates of dozens of bursts per second. L-bursts are seen near the bottom of the spectrogram. Diagonal bands in the
L-burst emission regions are modulation lanes.
The Sun
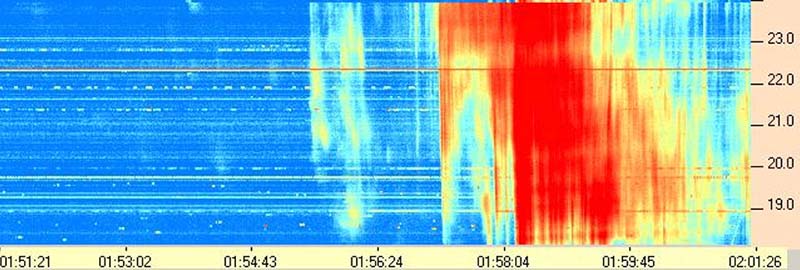
Solar Burst - A strong solar burst. Horizontal lines are stations of varying strengths.
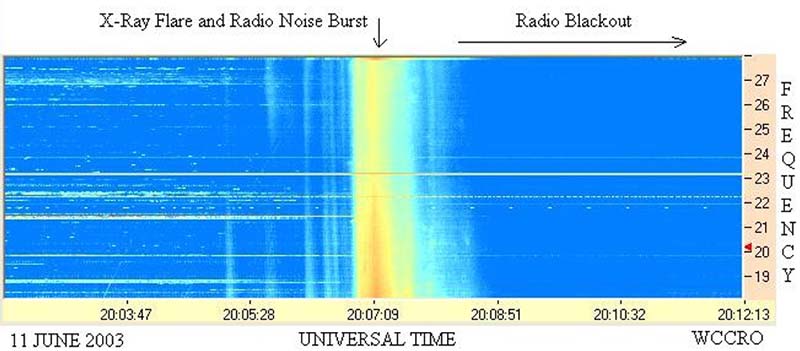
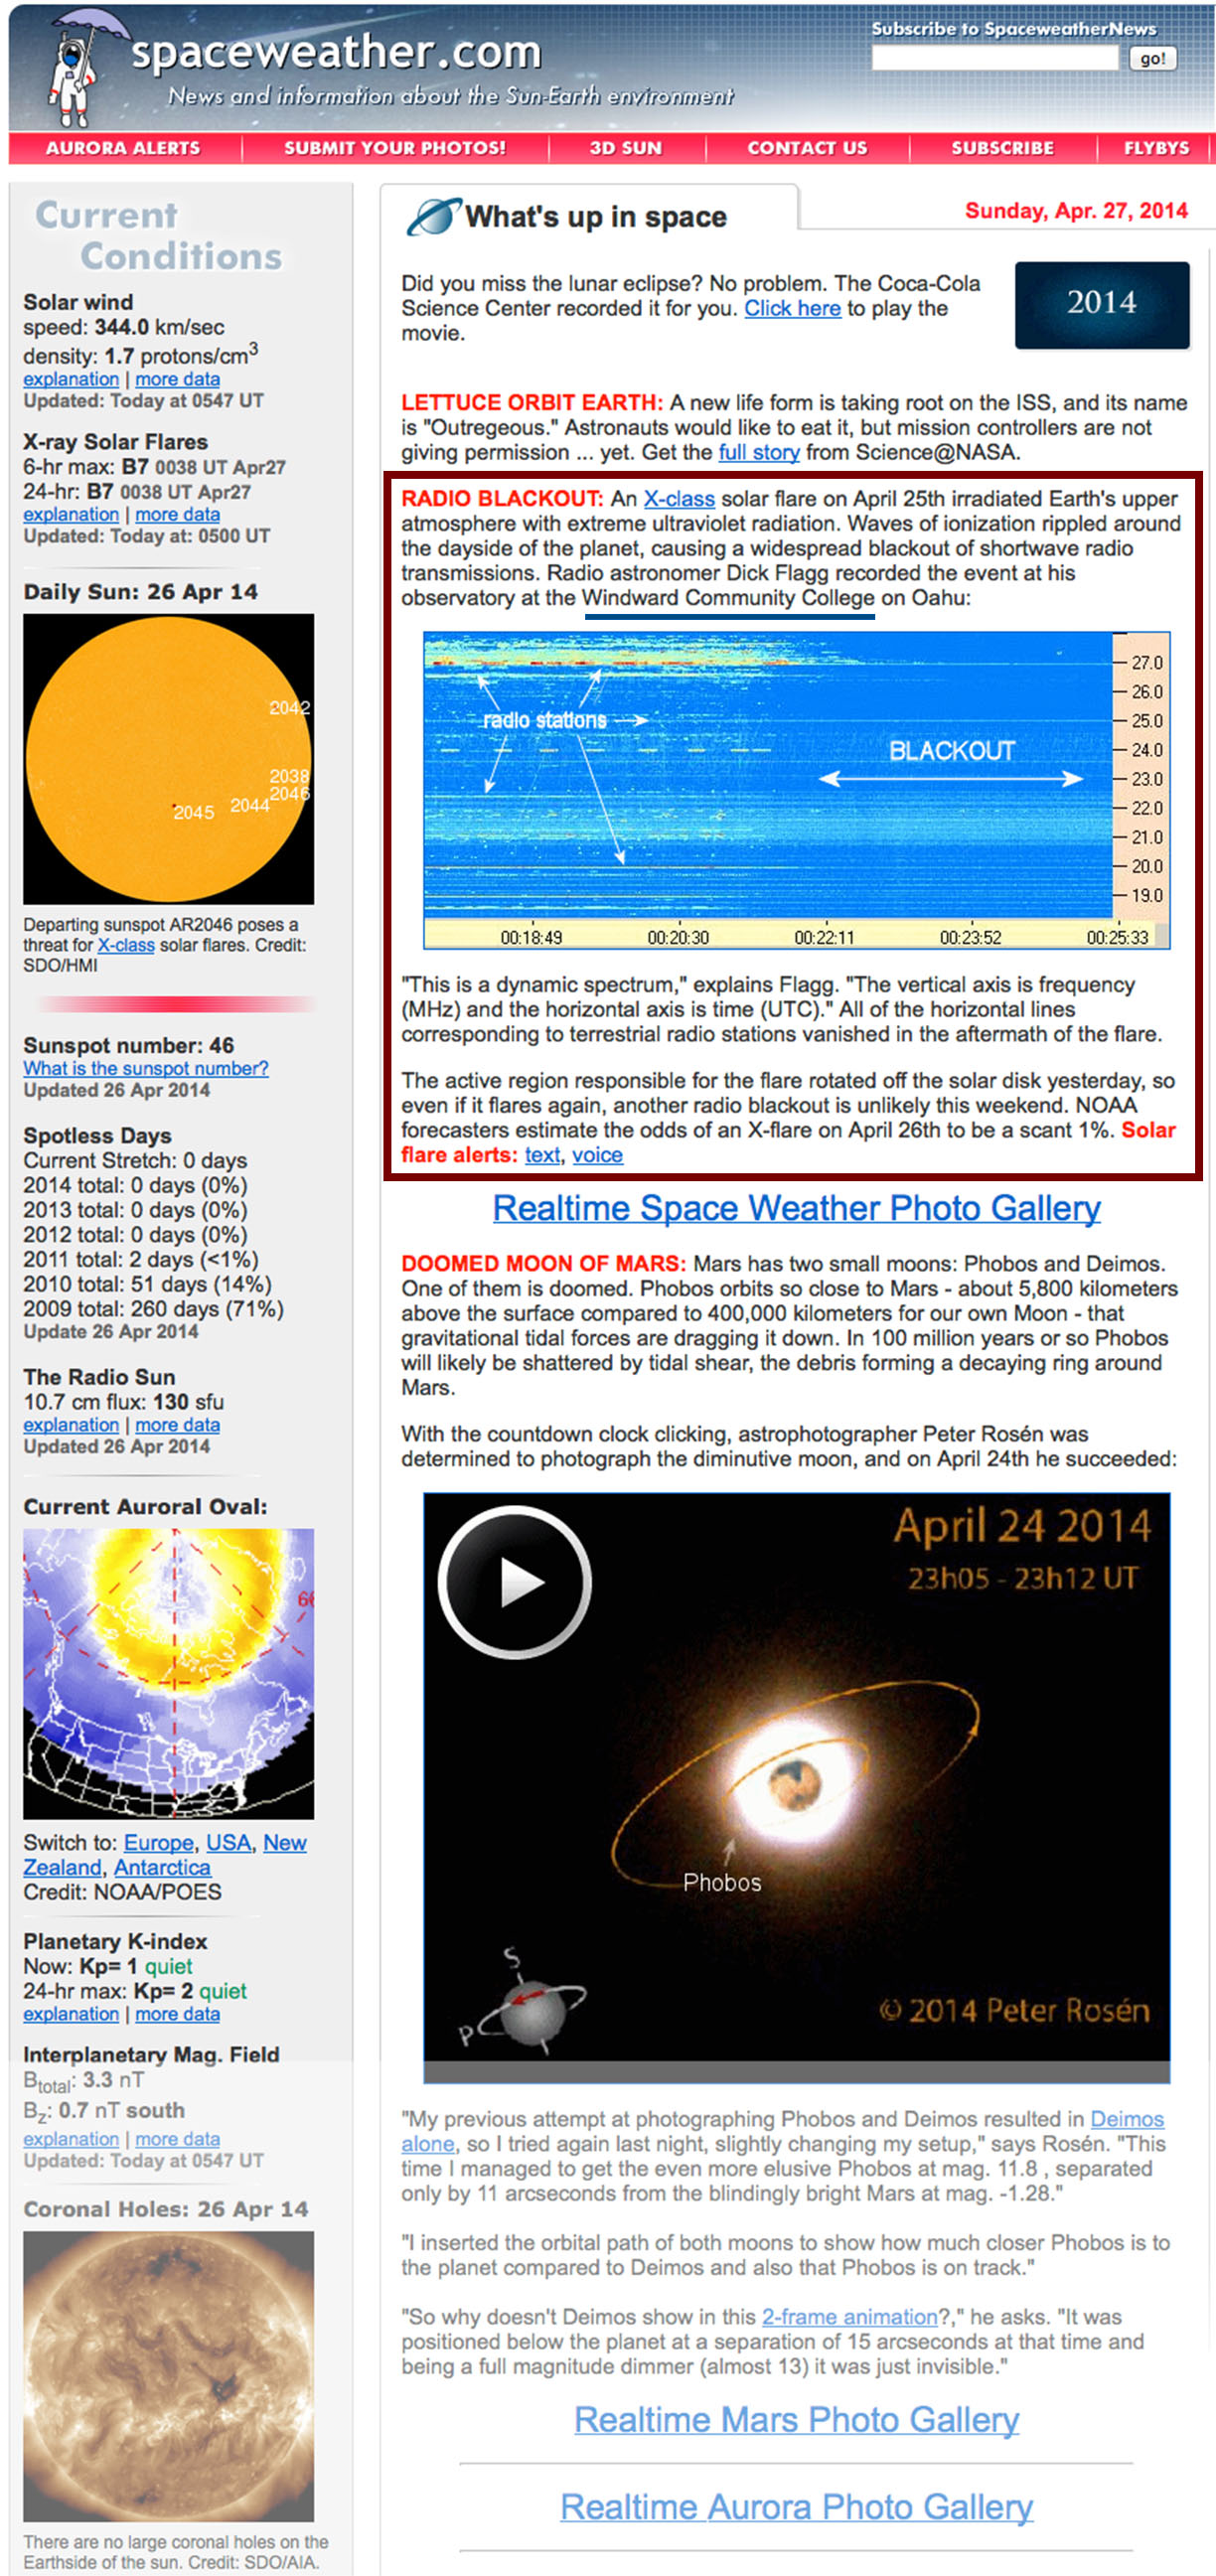
Solar Flare and Radio Blackout - Up until about 2007 UT the spectrum is normal with several stations (horizontal lines) present. Following the radio noise burst (which was accompanied by an X-ray flare) the spectrum appears devoid of most all stations. The X- ray flare has caused a dramatic increase in ionospheric absorption - which accounts for the fact that signals from most distant stations disappear in a radio blackout. The few remaining stations were probably local to the observing station in Hawaii, and hence their signals were not affected by the condition of the ionosphere.
Other Signals
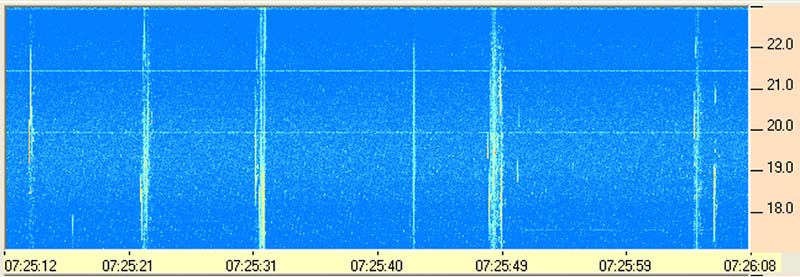
Lightning - The vertical lines are from distant lightning strikes while the horizontal traces at 20 and 21.5 MHz are weak stations.
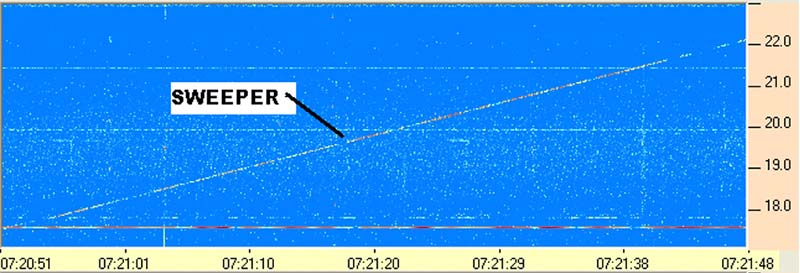
Ionospheric Sweeper - this signal is from an instrument used to measure properties of the earth's ionosphere. When a sweeper passes through the frequency of a Jove receiver it sounds like a short chirp.
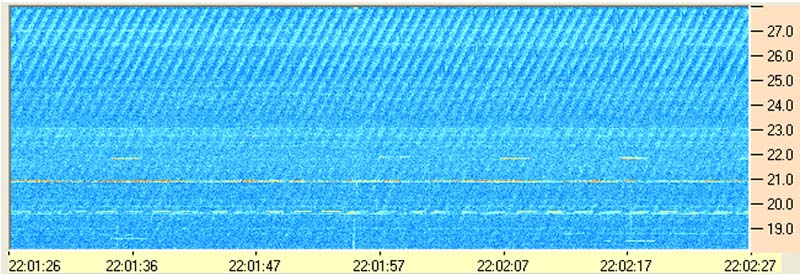
Power Line Arcing - The diagonal bands are courtesy of the local Hawaiian electric company (HECO). The slope of the lines results from arcing on the power lines which occurs 120 times per second beating with the sweep frequency of the receiver (10 sweeps per second. This interference often makes observations of celestial sources impossible.
Major Solar Events
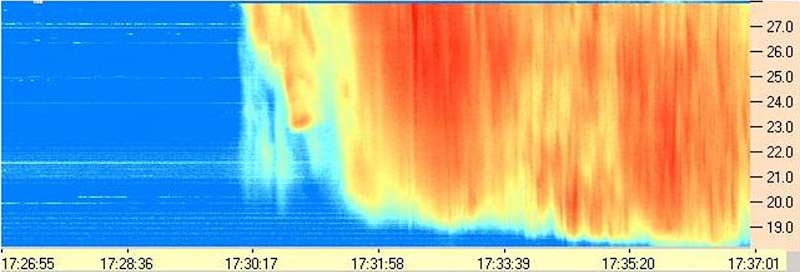
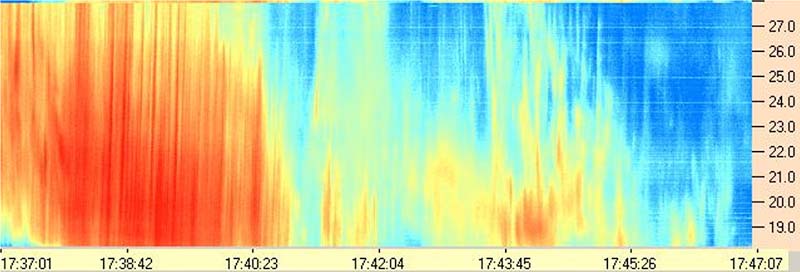
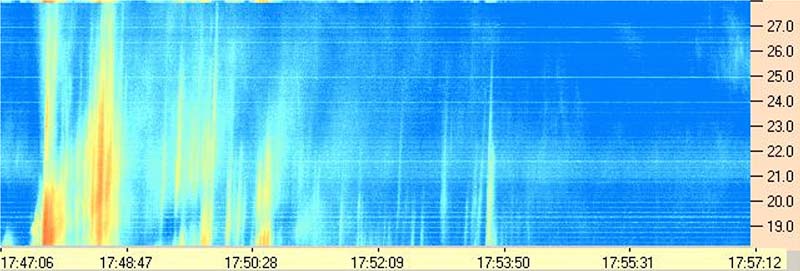
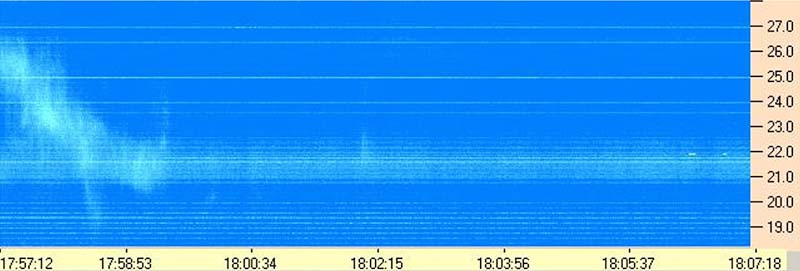
Radio spectrograms of major Solar Events in 2014 were recorded by the Radio JOVE telescope at WCC. Solar maximum had occurred in April 2014 with the number of sunspots peaking at 114 for that solar cycle 24 (well below average of 179), which makes these two events very dramatic.
Huge solar event. 10 September, 2014, WCCRO Radio Spectrograph, Oahu
